Which role does location play for a startup to get funded? Is capital truly mobile and do investors invest in all locations equally? These are the questions that kept us – as creators of the Startup Heatmap Europe – awake at night.
Well, we thought, why not start having a look! Armed with access to the massive Pitchbook investment database, we built a list of all venture capital investment deals between 100k € and 5mn € made in Europe within the last 3 years. We got a list of 4,180 deals showing both the location of each investor involved in a deal and the locations of the startups they invested in.
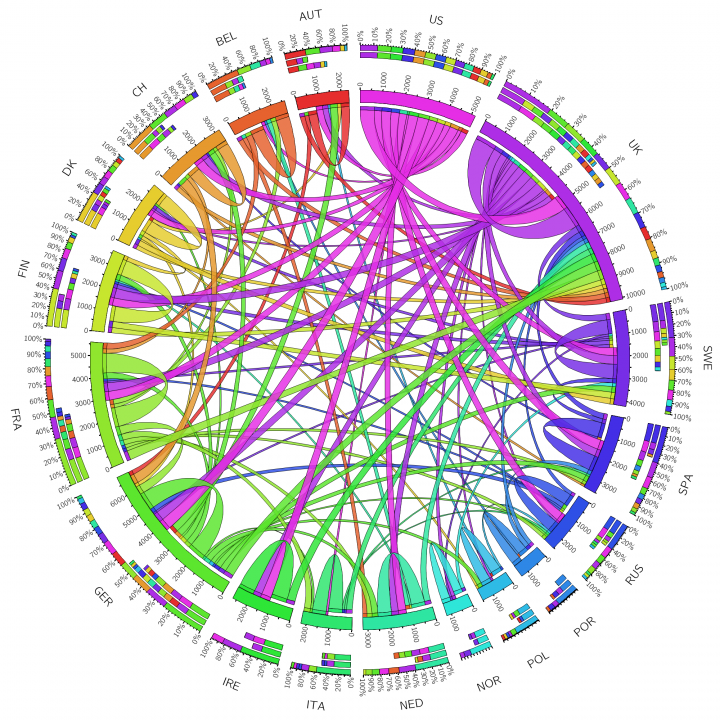
The dataset of course is massive and that makes it hard to visualize – in fact, putting it on the Startup Heatmap itself will be a lot of work and will take some time. However, in the meantime, we do not want to hide the results from you! Inspired by a presentation given by EIT Digital on how they connect startups with corporates from all over Europe, we decided to use the same tool they used: Circos Table Viewer, an impressive means to turn relational data in something between a cake diagram and a mandala.
The crazy diagram above shows country codes arranged around a circle and ribbons connecting them. The color of each ribbon corresponds with its origin. So, red ribbons leaving from AUT are investments coming from Austria – ending up in other countries or back in Austria. It definitely is a fun way to explore connections between countries – even though to limit the complexity to a bearable amount, we only included 18 countries.
Now, we had a few questions to ask the data and want to share the results with you:
Where do most investments in Europe come from?
Sticking to the data provided by Pitchbook, UK-based investors take the lead in number of investments, accounting for 1124 deals of which 86% were within their borders. In total, UK investors took part in a whopping 27 % of all deals made in Europe! This could either mean that Pitchbook’s data strongly favors English-speaking deal announcements or an unparalleled dominance of UK investment firms in the EU market. Probably both factors contribute to the result. In the ranking, France follows with 666 (601 at home), Germany 403 (317), the US 313 and Ireland 204 (188).
The US therefore plays a (surprisingly) smaller role in the European investment scene with roughly 7.7% of all investment deals originating here, which is comparable to the combined impact of Finland and Sweden. However, this does not include the investment sums, that could be higher as later stage US investors might do fewer deals but with higher sums in Europe.
Apparently not relevant were investors from China and Hongkong, who together make up for only 15 investments in European ventures.
How willing are investors to invest outside their home market?
Not so much. As the data shows, 73% of all investments come from domestic investors. When deducting the impact of non-European investors, we found that on average the European investors make roughly 17% of their deals in other European countries.
Is this a high or a low number? We cannot judge, but we can examine a bit further. For example, we see that smaller countries like the Czech Republic and Austria tend to invest much more abroad (73 % and 67%). Luxembourg as a popular fund location leads the ranking with 94 % of deals made abroad. However, the larger chunk of non-domestic deals come from the US and the UK, with the latter’s investors sourcing at least 13 % of their deals abroad.
Interesting is also the difference between German and French investors as the Germans invest significantly more abroad (21 %) and the French like to stay home (10 %). This difference even persists when deducting investments in same-language markets, like the DACH region for Germany (16% vs. 9 %).
If they go abroad, where do they like to invest?
Geographic proximity is often the main argument when investors are asked about location choices – however, once they go abroad, they do not limit themselves to the neighboring countries.
Here are the top 5 destination countries for investors from select origins with the absolute number of investments in brackets:
Germany: UK (20), Austria (11), Switzerland (8), Sweden, Netherlands, France (7)
France: UK (21), Germany (15), Italy (8), Netherlands, Belgium (5)
UK: Finland (22), Germany (19), Sweden (17), France (16), Ireland (12)
US: UK (110), Germany (36), Ireland (24), Spain (22), Switzerland
Which countries receive the most foreign investments?
Seeing the scarcity of foreign startup investments, it is exciting to see which countries are most attractive to outside investors and also who is most dependent on these (maybe due to a lack of domestic players).
In total numbers of foreign investments coming in the country the usual suspects lead:
- UK: 304 (24%)
- Germany: 131 (29%)
- France: 94 (14 %)
- Spain: 73 (36 %)
- Finland: 72 (32 %)
Indeed this seems to prove some earlier observations of a rather closed shop situation in France with few investments going out and coming in and a more international play in Germany and the UK. Interestingly, Spain and Finland show both high absolute numbers and percentages – indicating that here foreign investments play a crucial role in keeping the ecosystem running. Not surprisingly, we can mostly see UK and US investors being active here.
The highest percentage of foreign investments are again seen in small countries with Estonia (78%) and Austria (67%) as well as Czech Republic (67%) leading the pack. Also, Russia seems to be more dependent on outside investments with 53 % of all deals being done by foreign investors.
So where do people get their money from? From the UK!
Let’s put it this way: it doesn’t look like that there are strong investment flows between European countries and so most startups from small scale countries will need to keep looking onto home investors. Investments to other countries (except the UK) seem to be singular and spread among various destinations which seem to to follow a rather random distribution. For European policy makers, this of course can be a challenging observation – why is it so unattractive to invest across borders? And especially after the Brexit decision, what is Europe’s plan for the future?
Этот бот способен найти информацию о любом человеке .
Достаточно ввести никнейм в соцсетях, чтобы получить сведения .
Система анализирует публичные данные и активность в сети .
глаз бога информация о человеке
Информация обновляется в реальном времени с проверкой достоверности .
Оптимален для анализа профилей перед важными решениями.
Конфиденциальность и точность данных — наш приоритет .
Нужно собрать данные о человеке ? Этот бот предоставит детальный отчет в режиме реального времени .
Используйте уникальные алгоритмы для поиска публичных записей в открытых источниках.
Выясните место работы или активность через автоматизированный скан с гарантией точности .
зеркало глаз бога
Бот работает с соблюдением GDPR, используя только общедоступную информацию.
Закажите детализированную выжимку с историей аккаунтов и графиками активности .
Попробуйте надежному помощнику для исследований — точность гарантирована!
Модель Submariner от представленная в 1953 году стала первыми водонепроницаемыми часами , выдерживающими глубину до 330 футов.
Часы оснащены 60-минутную шкалу, Oyster-корпус , обеспечивающие безопасность даже в экстремальных условиях.
Дизайн включает светящиеся маркеры, черный керамический безель , подчеркивающие спортивный стиль.
rolex-submariner-shop.ru
Механизм с запасом хода до 3 суток сочетается с автоматическим калибром , что делает их надежным спутником для активного образа жизни.
С момента запуска Submariner стал эталоном дайверских часов , оцениваемым как коллекционеры .