The 2017 edition of the Startup Heatmap Europe survey ran from April to July. 321 founders from 30 countries responded to our call. The survey was closed and based on invitation. We worked with the research team of Pitchbook to identify a representative and random sample of for all the European startups registered in their database. This meant quite a far-reaching deviation from last year’s method where we had an open survey with over 700 participants coming through many partner accelerators and entrepreneurship groups all around Europe. We decided to follow this new approach to maximize the validity of our findings – especially since it would allow us to compare findings from both sampling methods and fine-tune future data collections.
If you haven’t downloaded your free copy of the report yet, you can do so here: http://www.startupheatmap.eu/download-report/
The European startup ecosystem changes continually. Companies are built, deals are made, and ventures fail everyday. The perception of a specific startup ecosystem is continually changing, based on each founder’s individual lens of analysis and scope. Due to the rapidly changing nature of this environment, obtaining a comprehensive selection of the unique individuals who populate this landscape is nearly impossible. Obtaining a sample of this population will in every case be limited. This survey is no different. Importantly, the Startup Heatmap Survey is not a scientific publication and even though we try to abide by the fundamental rules of scientific rigor and validity, we do see ourselves as a journalistic project, which points out tendencies rather than certainties. But despite these limitations, we want to stress the importance of transparency in this work and further research on startup ecosystems moving forward.
To be open about the quality of our data and its limitations, we lay out our methodology in the following paragraphs.
We used the following criteria to determine the total population of European startups included in the Pitchbook database:
- Headquartered in Europe (based on historical delimitations we selected 45 countries)
- Date founded: Later than 1/1/2012
- Ownership status is “privately held”
- Match one of 84 select innovative industry sectors
From a total population of 7,830 we extracted a representative sample of 1,500 based on regions and sectors. Unfortunately, the response rate on the initial call was low, so we asked partners and multipliers if they had direct contacts with the startups listed. Through this we could increase the response rate slightly to 15%, but had to realize that the data quality was also not as solid as we had hoped for, as the list included many companies that were not startups or not active anymore. Finally, we manually added 96 companies that we identified through Crunchbase to fill the gaps.

The resulting sample of 321 proved to be evenly representative of the two select sectors High-Tech and Internet as well as for the six pre-defined regions. We believe that the survey is a good representation of the total population (4%) as well as for the two sectors defined (5% vs. 4%). The regional representativeness is balanced enough to avoid biases. Therefore, statements that are concerning founders in Europe in general like the rate of mobility or the importance of certain factors for moving are the firmest. Here we have a margin of error of 5% at a confidence level of 95%. The more detailed the analysis gets, for example when examining regional distributions or even country level data, the more caution is necessary. While for the sector related questions the margin of error stays relatively low, for regional categories the margin of error is relatively high.

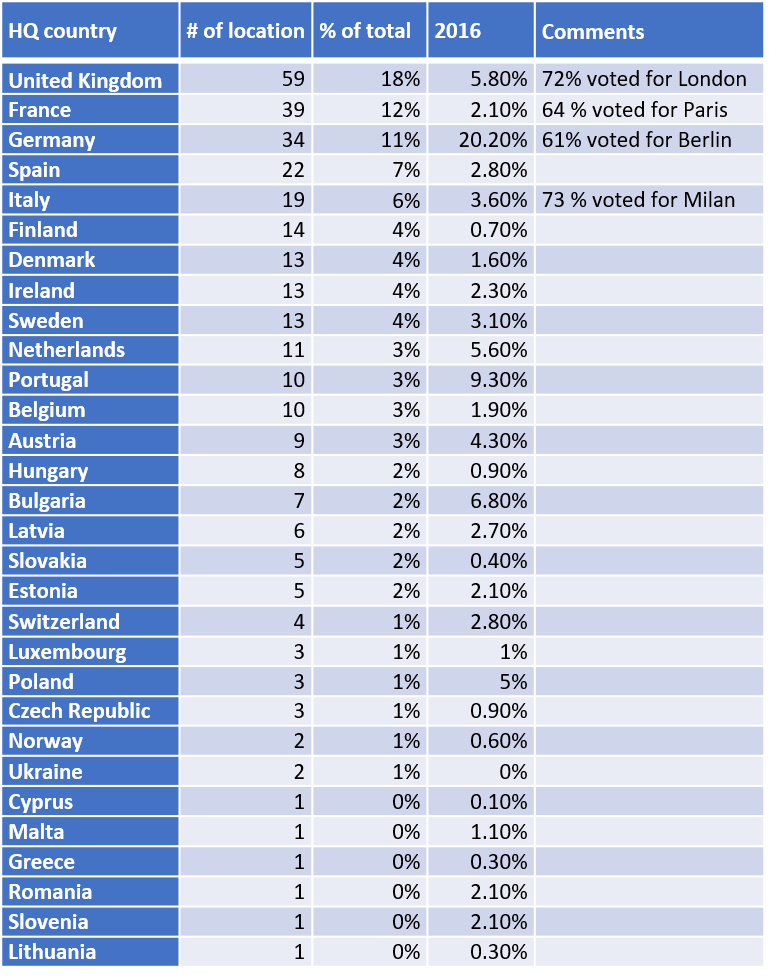
When comparing the results of 2016 and 2017 we observe wide confirmation for various themes, as for example the percentages in both years of founders who started their company abroad is stable (23% vs. 21%) also the percentage of those who left their broader home region is similar (85% vs. 88%). The comparison of factors for moving is however difficult as 2016 there were only 4 choices and 2017 we added 2 more. Nevertheless, access to talent remains at the top. When looking at the city rankings, it is remarkable that 8 cities appear again in the top 10, showing a strong validity of the survey. Nevertheless, one has to admit that the stronger participation of some countries could have played a role in the positioning of some hubs. London overtaking Berlin as number one can be partly explained by the higher representation of UK founders in the 2017 survey, which is justified by the higher number in the total population. However, for Paris who entered the top 5, even if we subtracted all French voters, we would not see a change in ranking. In general, we must say that the 2017 survey has a higher reliability in terms of representativeness.
To have complete transparency about the participation in the survey and potential effects on the results, we publish here the participation by country:

We believe in transparency of methodology, as it is the only way to have an honest debate about how to measure the development of this unique ecosystem. The Startup Heatmap is continually iterating. The team is continually working to improve the design and ensure the results become stronger. Importantly, despite the significant change in survey design from the previous year, we see a number of trends continuing to stay robust. While the leverage these individual results can give is limited, their durability indicates this work is moving in the right direction. Working together with the community, our ultimate goal is to develop continuous monitoring instruments to capture how the interconnectivity of the European startup ecosystem is evolving. We hope this edition of the Startup Heatmap Europe is a step in the right direction.
