
The Startup Heatmap survey aims to identify some of the most desirable startup locations across Europe. What the survey most clearly indicates, is that each entrepreneur weighs the importance of these considerations differently. For European entrepreneurs, there are many factors that go into the perfect startup location, from access to talent, ease of finding capital, and quality of life. Berlin and London, this year’s top locations, score high on many of these metrics.
While these cities might be some of the most desirable startup locations in Europe, not all entrepreneurs are looking to move. Some are quite happy where they are. Great companies are built all over Europe, in many locations that never appear on the top of indexes and media mentions. We can learn a lot about what makes a great startup location when we look at how entrepreneurs evaluate they are currently.
In our survey, we ask entrepreneurs to evaluate their satisfaction with several characteristics of their current startup location. They are asked to rate, positively, negatively or neutral:
- Access to talent and quality of local labor market, specifically the availability of graduates and experienced talent
- Access to capital, in terms of noteworthy venture capital and public funding
- Ease and cost of doing business, bureaucracy, taxation and living costs
- Entrepreneurial ecosystem and culture, including mentors, incubators, accelerators, events.
Regional Comparisons
Across our entire sample population, just over 50% were generally satisfied with their startup locations, with the remainder, a bit more critical. These results varied somewhat according to where our entrepreneurs were located. Entrepreneurs that were headquartered in the UK and Ireland were the happiest in our survey, with 56% expressing satisfaction with their startup locations. The Western region, comprising of Germany, Austria, France and Switzerland was not far behind, with 55% expressing approval with their startup locations. The Western region also expressed the lowest “disapproval” rate in their startup location, with only 10% of respondents from the Western region indicating an average disapproval. In contrast, Entrepreneurs based in the Mediterranean (Spain, Greece, Italy, Portugal, Malta and Cyprus) expressed the lowest rates of approval in their startup locations, with only 40% expressing positive feelings about their location. A further 35% of entrepreneurs surveyed from the Mediterranean expressed a more neutral result, suggesting neither approval nor disapproval over their startup location.
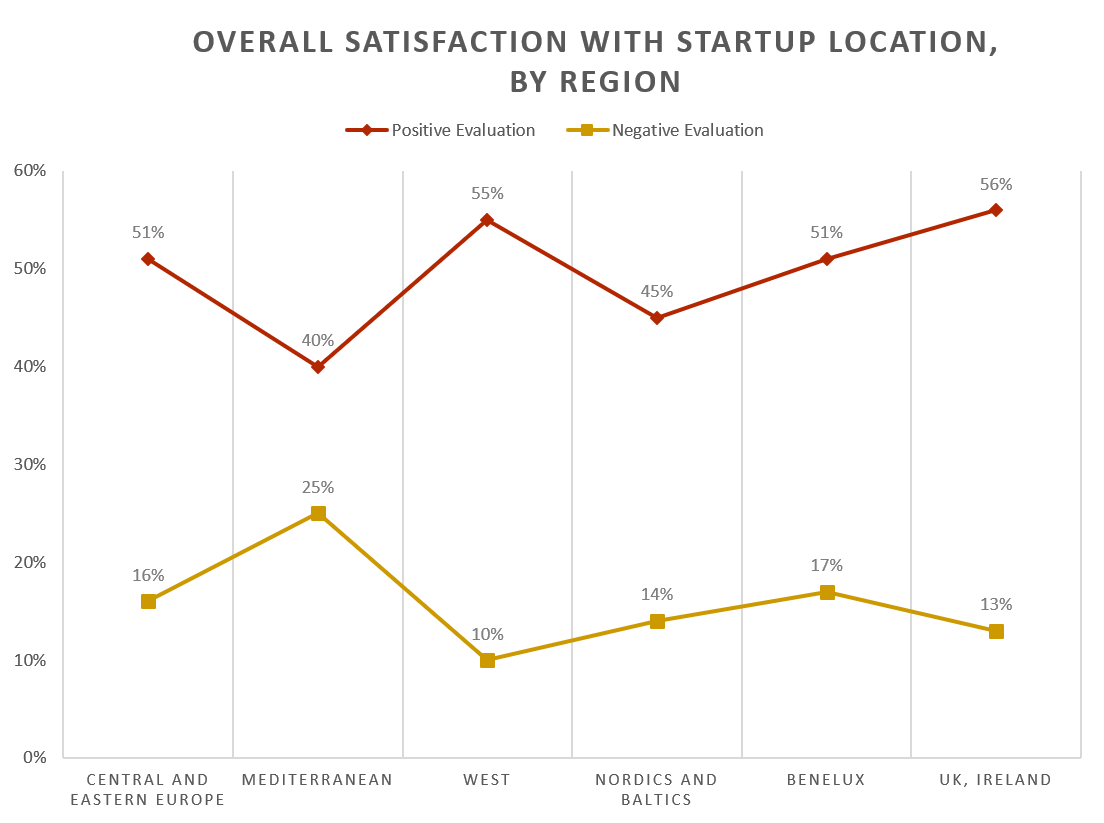
When looking at the graph above, take a look at the space between the two trend lines. This gulf represents the distance of those that consider their startup location to offer neutral opportunity—neither positive nor negative. It can be difficult to evaluate this space, especially considering the amount of data, and the associations that respondents can attribute to a neutral opportunity. At first glance, we do see some regional variation in this data. For example, we can see respondents from the Mediterranean region choose a neutral result fewer than all other regions, and respondents from the UK and Ireland express a neutral result most often.
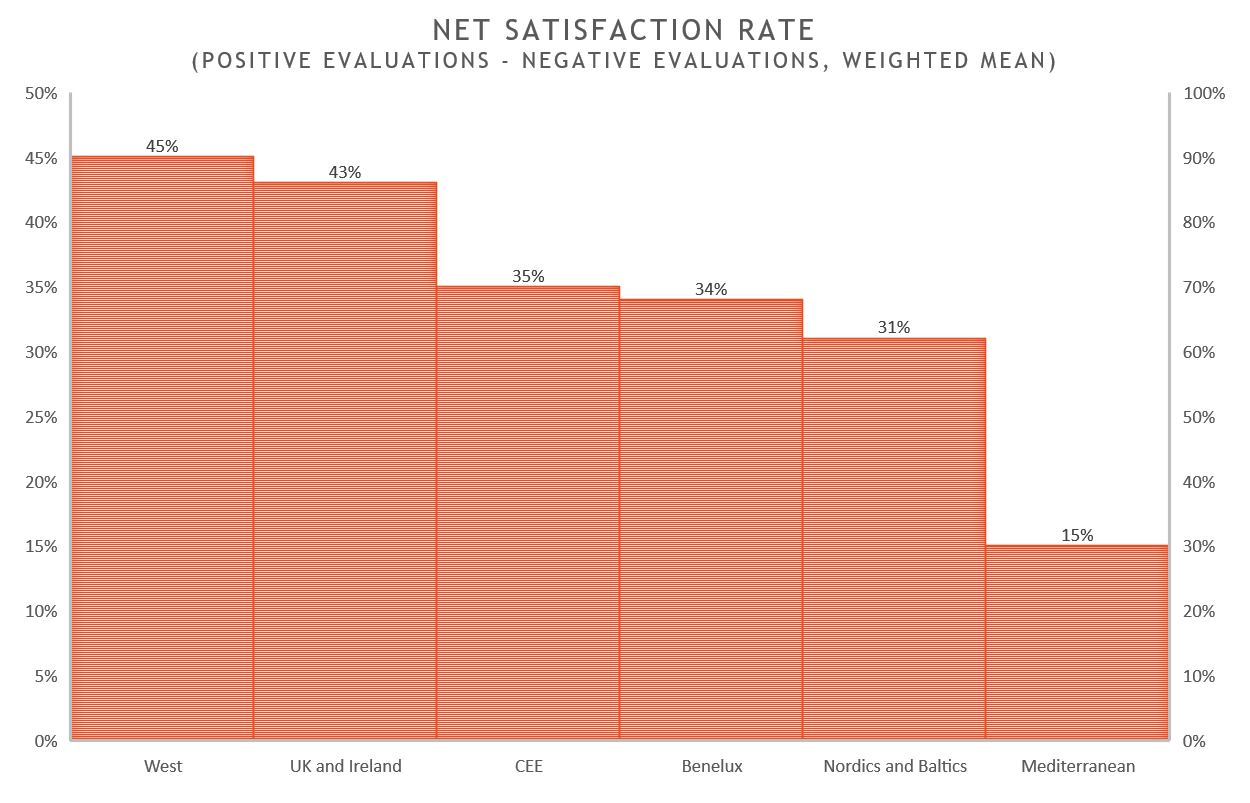
When we combine the results together to develop the net satisfaction rate, a different picture emerges. The net satisfaction rate combines the standardized values of those that rank their locations positively as compared to those who rank their locations negatively. Neutral results are removed. Here, we see a much more drastic result, especially for the Mediterranean respondents, due to the high number of respondents expressing dissatisfaction compared to those expressing an alternative view.
What do entrepreneurs like best about their startup locations?
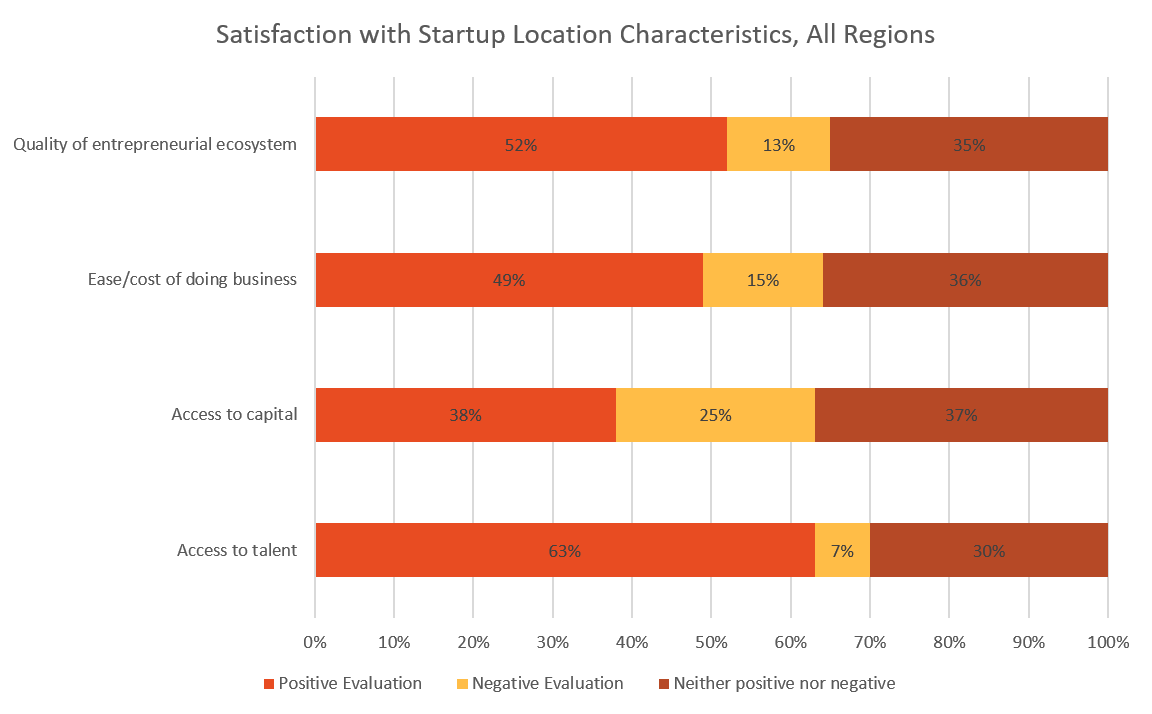
Overall evaluations can only tell part of the story, as an entrepreneur’s evaluation of their startup location can vary significantly according the amenities in their specific location. When we look closer at some of the components of a startup location, we see quite a lot of variation exists between how entrepreneurs evaluate specific components about their startup location.
- Access to talent and quality of local labor market, specifically the availability of graduates and experienced talent
- Access to capital, in terms of noteworthy venture capital and public funding
- Ease and cost of doing business, bureaucracy, taxation and living costs
- Entrepreneurial ecosystem and culture, including mentors, incubators, accelerators, events.
From these results, we find that our selection of entrepreneurs approve of their access to talent the most, and are least happy with their access to capital.
How do regions differ in their location evaluations?
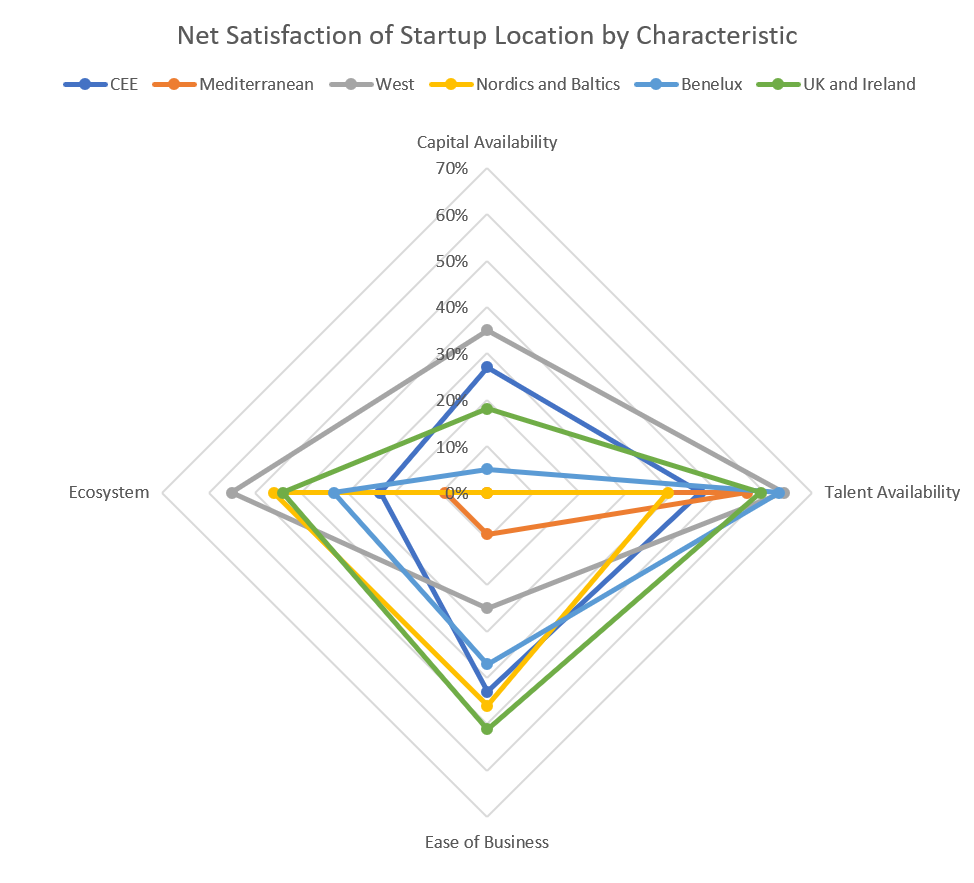
When we develop the net evaluations, some surprising results emerge between regions. All regions expressed a relatively healthy approval in their access to talent, with an average approval rate across all regions as 63%. The UK and Ireland and the West region countries expressed levels above the mean, with both regions expressing 67% satisfaction with their access to talent. The Nordic and Baltic countries indicated the highest amount of disapproval with their access to talent in comparison to the other regions, with a 13% disapproval rate.
As we might expect, Mediterranean respondents cited the highest disapproval ratings for a majority of the factors, displaying the highest rates of disapproval for Access to capital (35%), ease of doing business (28%) and the quality of the entrepreneurial ecosystem (26% disapprove). In contrast, the CEE (Central and Eastern European Countries expressed the highest levels of approval with their access to capital (50%) and the ease of doing business (60% approve). The Western region expressed the highest satisfaction with their entrepreneurial ecosystem, at 64%, a considerable difference compared to the mean value of 52%.
The graph below shows the differences between net satisfaction of location characteristics, by region. The landscape visually represents the magnitude of regional differences, but also some surprising similarities. For example, while the Nordic/Baltic region and the Mediterranean region show many differences, they both have a negative association for Capital availability, with a majority of entrepreneurs surveyed from each region report that capital availability is more negative than it is positive. The magnitude of these negative results overcomes that of the fewer number of positive results.
Next steps and further analysis
The complexity of graph above is illustrated of the multifaceted ways that startup locations can be evaluated. It is one way to representation of the magnitude of difference between each of the regions surveyed, but much can be lost within these regional categories. While just over 50% of our sample expressed satisfaction with their current location, this visualization and the graphs above indicate a more nuanced examination is necessary to further develop and understand the disparity between regions to garner a more complete picture.
Importantly, these figures indicate a great diversity of satisfaction scores across regions. A few specific trends emerge for further study. First, we see that Mediterranean respondents were more likely to express dissatisfaction with their startup locations across nearly all indicators when compared to other regions. While the data cannot tell us with certainty, this finding may suggest a higher likelihood that Mediterranean founders may be considering new locations for their startups. In other instances, we find a few surprises. Some regions, express sentiments far outside overall mean values—for example, 50% of Central and Eastern European respondents report being satisfied with the availability of capital in location, as compared to only 38% of respondents overall. This result helps to encourage greater introspection to understand some of the factors that contribute to this alternative assessment of the capital climate.
While these regional associations can help to point to some interesting trends, it is important not to overstate the weight and magnitude of this data. Each of these individual survey responses helps to relay an individual, valuable opinion, from a unique and personal perspective. It is imperative that we do not ascribe any association to the data beyond what it can.
Further work is necessary to help untangle some of the unique currents that run through these survey responses. For instance, how do these results change when we compare results according to city, or local level data? How do industry or sector trends change entrepreneur’s location evaluations? What happens when we control for certain effects, such as GDP, economic growth, or business development, alongside? It is important to realize the limitations of the data and to identify key areas where it can help to shed light. Stay tuned to further work from the Startup Heatmap team as we continue to examine and analyze how our respondents evaluate the best locations to startup in Europe.
Comments are closed.