III) What Dynamics Spur the Growth of Ecosystems?
Investment give us a general overview of the performance of startup ecosystems, but what are the input factors and dynamics that shape these results?
The growth of regional innovation spaces is driven by a variety of factors. We try to capture these by analyzing the following questions:
- Communities & Their Purpose
- Transnational Connectivity
- Diversity
- Startup Support Organizations & Entrepreneurial Leadership
A) Communities & Their Purpose
Startup success is often credited to the support of a tight-knit community providing networks, access to resources and a helping hand in the early-stages of a company. As communities are rarely motivated by funding nor do they participate in the upside of equity investments, they are driven by a common purpose, that binds them together and motivates them to collaborate. It is therefore important to understand around which issues and trends tech communities organize – be it of benevolence, curiosity, or business ambition.
Paradox: Meetups Increased During Pandemic
Table 20: Percentage change of meetup participation per city
Source: Atomico / meetup.com
Year | Meetup Participants |
2017 | 1,309,352 |
2018 | 1,387,801 |
2019 | 1,521,415 |
2020 | 1,722,391 |
Table 21: Sum of group members on tech related meetups in 21 tracked cities
Source: Atomico / meetup.com
A practical indicator for the level of activity of the community is to measure the participation in and frequency of startup related meetups.
First of all we observe a curious trend: During the pandemic the popularity of meetups overall did increase, not slow. The participation in tech related meetups tracked on meetup.com did increase by 13% throughout 2020. This shows that many of the meetups were held online and that founders rushed to participate.
Even more interesting are the emerging regional differences: Large startup hubs saw large increases, while less international known places lost participants. Stockholm is the city with the biggest jump in the sample with +156% participants in local meetups, showing that many international founders were tuning into the otherwise local exchanges. The same we observe for London (+64%) and Berlin (+51%). Other hubs, who did not benefit from that increased international attention, like Madrid (-58%) or Budapest (-45%) suffered from an expected decline in participation. In a way the pandemic allowed for a more level playing field, where founders were able to choose freely in which ecosystem, they would like to be embedded in.
City | Meetup Title | Group Members |
London | Outreach Digital | The Marketing, Analytics, UX & Tech Club | 19,351 |
Stockholm | STHLM TECH Meetup | 16,838 |
London | London New Tech | 16,743 |
London | Technopreneurs – Tech Startups and Entrepreneurs | 15,558 |
London | Silicon Roundabout | 14,698 |
Tel Aviv | Full Stack Developers Israel | 13,384 |
Tel Aviv | Meetups at Wix | 13,274 |
London | ProductTank | 12,513 |
Paris | Le Wagon Paris – Coding Bootcamp | 11,948 |
Tel Aviv | Product Management Meetup (IL) | 11,297 |
Table 22: Europe’s largest tech meetup groups on meetup.com
Source: meetup.com
The increased online activity of the startup community during the pandemic allows us to understand the trends that move entrepreneurs in Europe. We therefore turn to analyze emerging topics by monitoring tech meetups, social media debates and tech news blogs. The Startup Heatmap has built up a monitoring system that tracks >1mn datapoints every year and allows for qualitative and quantitative text analysis. To understand the strength of a tech trend, we created an index based on buzzwords mentioned on twitter and tech blogs.
For FinTech Entrepreneurs it is either up or out
We open the analysis by looking at the Top 10 topics of the startup scene in 2020 and 2019. As presented in Table 2, AI & Data is dominating the debate, confirming the insight coming from the investment analysis. Fintech in contrast was sharply declining in attention of communities, dropping from 1st to 4th rank with only 7% share of voice in 2020. New emerging topics are indeed entering the debate making the general atmosphere extremely heterogenous. In term of share of voice, Creative & Culture, Mobility, Health & BioTech, CleanTech, Sustainability, Logistics and AgriTech are increasing. With the last three making a new entry into the top 10 this year.
| Top 10 Topics 2020 | Share of voice | ||
| AI & Data | 12.02% | ||
| Creative & Culture | 7.05% | ||
| Mobility | 6.89% | ||
| Fintech | 6.75% | ||
| Mobile Internet | 6.71% | ||
| Health & BioTech | 4.94% | ||
| CleanTech | 4.67% | ||
| Sustainability | 4.64% | ||
| Logistics | 3.19% | ||
| AgriTech | 3.17% | ||
| Top 10 topics 2019 | Share of voice | ||
| Fintech | 12.63% | ||
| AI & Data | 11.84% | ||
| Creative & Culture | 9.33% | ||
| Mobile Internet | 7.68% | ||
| Mobility | 5.88% | ||
| Cybersecurity | 5.20% | ||
| Sustainability | 4.92% | ||
| Health & BioTech | 4.11% | ||
| CleanTech | 3.71% | ||
| Gaming | 3.40% | ||
Table 23: Share of voice of Top 10 Topics in 2019 and 2020
Source: Startup Heatmap Europe monitoring of social media and tech news
Mapping these results on a plotter chart, we see the large-scale decline for FinTech again. Graph 4 shows the data for 2019 on the horizontal and 2020 on the vertical axis. Consequently, all points above the line are increasing in relative attention, while those below the line are decreasing. This leads us to suppose that FinTech communities are declining, as the industry matures and entrepreneurs in this field are either “moving up”, i.e. professionalizing and being less interested in community activity, or out of the sector. AI & Data, Mobility, Health & BioTech, and CleanTech seem to follow a positive trend instead and are emerging topics in the European startup scene.
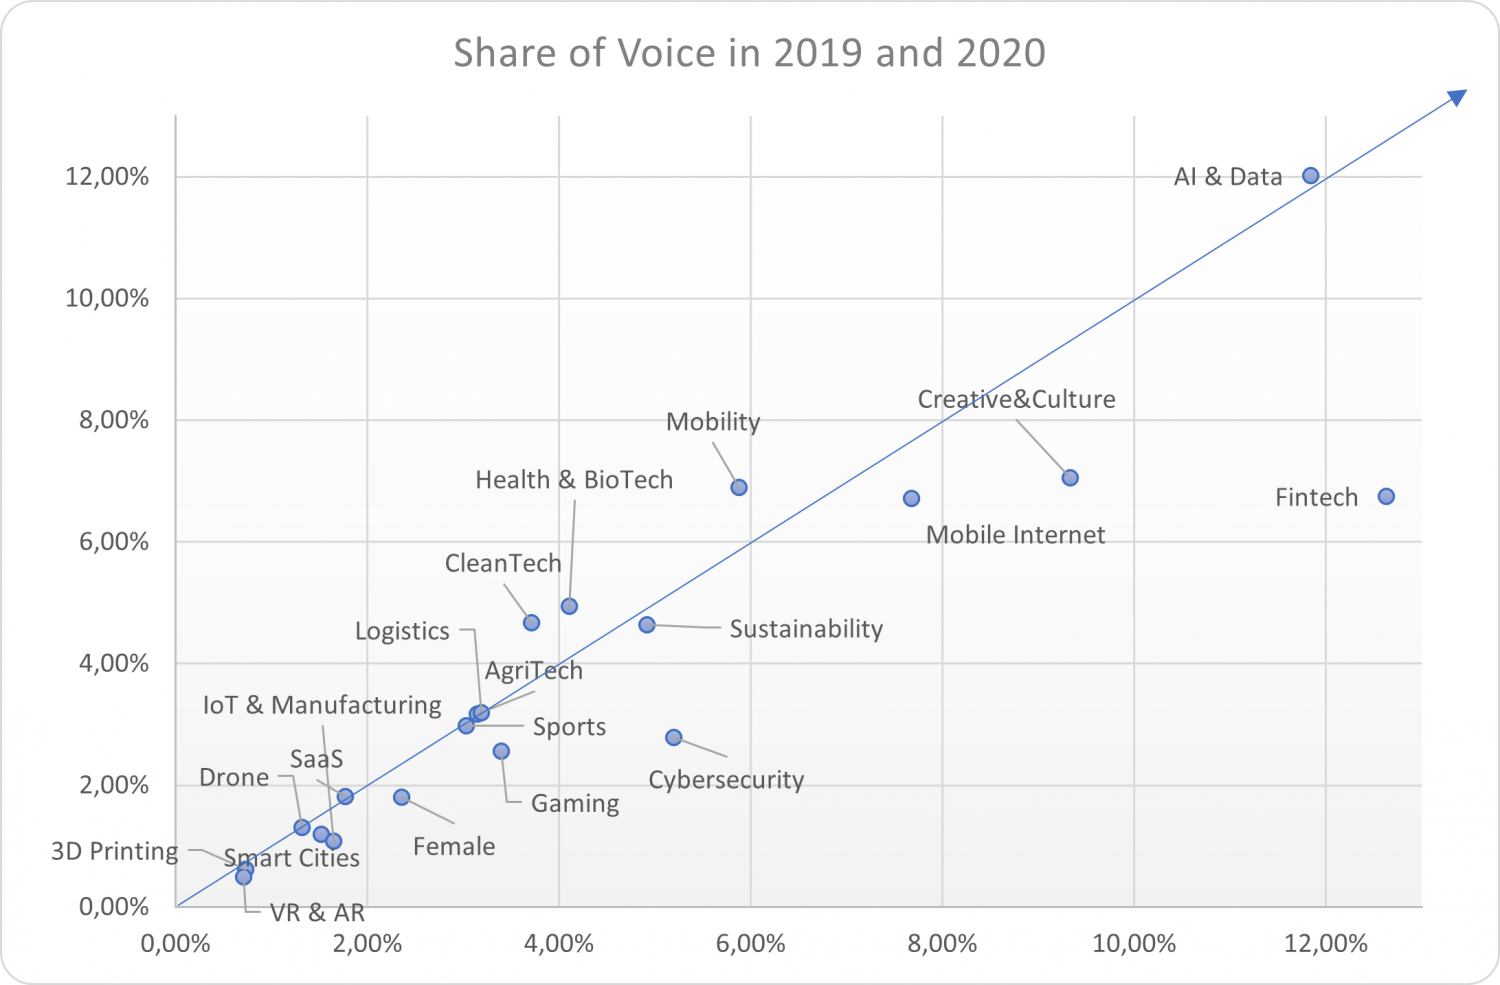
Graph 9: Share of Voice by topics in 2019 and 2020
Source: Startup Heatmap Europe monitoring of social media and tech news
Example: Fintech Nearing its Zenith?
Fintech is the largest vertical by total investments in Europe (>8.3bn € in 2020). However, some signals point towards a slowing of the growth. While in 2019 Fintech was the most important trend for founders, its share of voice dropped from 13% to 7% in 2020. Also seed investments in Fintech, which can be seen as an indicator for future growth potential, started to decline in 2019 and shrank by 17% in 2020.
Betting on the Right Horse: Specializations Offer Growth Perspectives
Comparing this pattern of topic setting with an analysis of >3,000 regular community meetup groups in 102 cities, we see a similar pattern: AI & Data is a topic in 21% of the groups, while 14% focus on Creative & Cultural topics. Fintech lands on third rank with 7% of meetup groups being organized around this vertical. More interesting are regional specializations. We analyzed where communities seem to have a particular focus by comparing the share of all local meetups and twitter mentions a topic captures. For the emerging topics of CleanTech, Health & BioTech and Mobility we find interesting results of hubs that have already built a strong community around these trends.CleanTech:
Cologne has a strong focus on Cleantech, which is explained by the large number of traditional energy intensive corporations or energy producers in this part of Germany who are pushing for innovation in these sectors. There is for example an active meetup community of >500 members around Düsseldorf also reaching into Cologne, that focuses on the revolution of the energy market. Startups like Envelio, a developer of smart grids, or Einhundert Energie, providing digital green energy, are starting to make headlines with increasingly large Series A rounds.
Location | CleanTech Focus |
Cologne | 3% |
Lisbon | 2.6% |
London | 2.5% |
Dublin | 2.4% |
Berlin | 2.2% |
Table 24: Largest share of voice of CleanTech topics per city in 2020
Source: Startup Heatmap Europe monitoring of social media and tech news
Health & BioTech:
Edinburgh has a unique position as a health tech cluster, driven for example by the Edinburgh bioQuarter and the vision to create Scotland’s £1bn Health Innovation District. The 2nd most successful startup from Edinburgh after the world famous Skyscanner is a biotech called NuCana, who works on a cure for cancer patients.
Location | Health & BioTech |
Edinburgh | 8% |
Helsinki | 6.3% |
London | 5.1% |
Warsaw | 4.8% |
Vienna | 4.5% |
Table 25: Largest share of voice of Health & BioTech topics per city in 2020
Source: Startup Heatmap Europe monitoring of social media and tech news
Mobility:
There is not yet a notable mobility startup from Prague, yet with the city’s sustainable mobility plan as well as the opening of EIT’s Central Eastern Headquarters for its Urban Mobility KIC, the activity around this trend has taken up. Shortly behind Prague we see Munich as a hub that has a strong focus on the mobility trend, with impressive startups like the flying taxi by Lilium Aviation or the e-car of Sono Motors. Given the vicinity of both hubs, maybe there is a particular opportunity for collaboration on this trend?
Location | Mobility |
Prague | 8.6% |
Munich | 7.9% |
Tel Aviv | 6.8% |
Edinburgh | 5.8% |
Budapest | 5.4% |
Table 24: Largest share of voice of Mobility-related topics per city in 2020
Source: Startup Heatmap Europe monitoring of social media and tech news
B) Talents & Diversity
The US has 38% more developers per Capita than Europe
A key component of talent is the availability of IT developers. Based on the estimations of stackoverflow.com user statistics, Atomico has estimated the growth of full-stack developers in Europe (including Ukraine, Russia and Turkey) from 2017 to 2019 to be 11%, while the US developer population was declining. However per capita we see that Europe’s developer base is still remarkably lower than in the US.
| 2017 | 2018 | 2019 |
Europe | 5.5mn | 5.7mn | 6.1mn (817 / 100k capita) |
USA | 4.4mn | 4.4mn | 4.3mn (1,310 / 100k capita) |
Table 25: Number of Developers per region
Source: Atomico / Stackoverflow
The hubs with the highest developer communities in Europe are matching at least partly with the list of top hubs, with London and Paris on top, followed by Amsterdam. Interestingly, Berlin is missing from the Top 5, which could be explained by the relatively small corporate sector in Berlin. That is different for Cologne, one of Germany’s industrial centers, that is positioned 4th based on the total amount of developers.
City | Professional developers |
London | 357900 |
Paris | 268600 |
Amsterdam | 216800 |
Cologne | 165900 |
Moscow | 160900 |
Table 26: Largest number of developers per City in Europe
Source: Atomico / Stackoverflow
31% of European Founders Know How to Code
But how large is the share of engineers and programmers among founders? It is of course not a requirement to be able to program yourself to start a digital company. However, when looking at >3,000 founder profiles we found the percentage of founders who know how to code surprising: Only 31% of European founders state IT skills as one of their strengths, while explicitly simple programming languages like HTML were included. Among male founders this percentage is slightly higher with 35% while only 16% of female entrepreneurs are familiar with programming.
There is also large differences between cities. In general cities in Eastern Europe seem to have more tech-skilled founders than Western Europe. Cluj-Napoca, a strongly developed nearshoring hub for Europe’s industry, leads the list with an impressive 65% share of tech-skilled founders, followed by Timișoara (55%) and Brno (53%), the home of Avast, in Czechia.
City | Country | % Founders with Tech Skills |
Cluj-Napoca | Romania | 65 |
Timișoara | Romania | 55 |
Brno | Czechia | 53 |
Bucharest | Romania | 52 |
Bratislava | Slovakia | 45 |
Vilnius | Lithuania | 45 |
Tel Aviv | Israel | 45 |
Ljubliana | Slovenia | 44 |
Helsinki | Finland | 42 |
Zagreb | Croatia | 42 |
Table 27: Largest share of founders with tech skills
Source: Startup Heatmap Europe, Analysis of >3,000 founder profiles in 2020
Discrimination against women founders costs 3bn € in 2020 alone
It is a known fact that female founders are widely underrepresented when it comes to VC funding. Startups with women in the founder team only attracted 8% of total investments in 2020 according to our analysis of data from dealroom.co. Even worse: The trend is negative, having decreased from 10% in 2018 to 8% in 2020. This number is of course also dependent on the number of female founders active in the startup scene, which in 2020 stood at 15.5% as we revealed based on an analysis of 20,000 founder profiles in 2020. There is two issues to be observed separately when talking about gender parity:- Acceptance of Women as Founders
- Equal opportunity to receive funding
Total investments in Europe | Female founders in Europe | |||||
Funding amount every 12 months (€) | Nr. of round every 12 months | Female Founders Raised € | Nr. of rounds | % amount on total inv. | % rounds on the total | |
2020 | 40.4bn | 4,967 | 3.3bn | 554 | 8% | 11% |
2019 | 38.9bn | 5,774 | 3.6bn | 712 | 9% | 12% |
2018 | 27.2bn | 6,104 | 2.6bn | 810 | 10% | 13% |
2017 | 23.6bn | 6,718 | 1.9bn | 882 | 8% | 13% |
2016 | 17.5bn | 6,819 | 1.6bn | 842 | 9% | 12% |
2015 | 15.8bn | 5,909 | 1.5bn | 701 | 9% | 12% |
Table 28: Investments into startups with at least one female founder in Europe over time
Source: Dealroom.co
A major question relevant for the estimation of gender parity in VC funding is of course the long-term effects of total investment sums. A lower share of female entrepreneurs in the years 2010-15 might still have an over proportional effect on today’s dynamics. One could argue that changes in the VC industry taking place in the last 3-5 years still need time to take effect.
For this question we have analyzed how startups founded by female entrepreneurs performed when they joined an accelerator in the years 2017-2019. We found that 75% of women entrepreneurs manage to raise VC funding after the acceleration – the same rate as their male counterparts. However, the median amount raised is 38% lower for female founders and it takes them longer to achieve this result. See more on this in our recent report on Women Entrepreneurs from 2020.
European startup hubs are however not homogenous in these trends, as the share of female founders across cities varies strongly. We might even contemplate that a low share of female entrepreneurs is a disease of the established large ecosystems in Western Europe. The largest shares among the big hubs are still below 20% with Stockholm leading this group (19%) followed by Berlin and London reaching each only 18%. In contrast to this, some small and mid-sized ecosystems reach a much higher share of female founders. Vienna is the overall champion in this category with 34% women entrepreneurs, followed by Budapest (30%) and Oslo (26%).
Location | % female |
Stockholm | 19% |
Berlin | 18% |
London | 18% |
Amsterdam | 16% |
Zurich | 15% |
Location | % female |
Vienna | 34% |
Oslo | 26% |
Bucharest | 21% |
Lisbon | 21% |
Brussels | 20% |
Location | % female |
Budapest | 30% |
Sofia | 25% |
Luxembourg | 23% |
Athens | 20% |
Istanbul | 16% |
Table 29: Share of female founders by city in categories based on investment size
Source: Women Entrepreneurs Report by Startup Heatmap Europe 2020
Female entrepreneurship is only one factor of diversity and inclusivity. Many other groups, suffering from exclusion and discrimination, are harder to measure and we must revert to assuming a similar pattern than for female entrepreneurs, if not worse.
Top Hubs have >65% foreign-born founders
One further indicator for the inclusiveness of the startup scene is the share of foreign-born founders. Here we rely on our aggregated survey data of the past five years, asking participants about their origins and destinations. There is an increasing trend over the years showing that more and more founders are international. Also we see a clear indication that tech hubs that are successful, base their success on the immigration of talent from abroad. Major hubs like London, Berlin and Barcelona have shares of 65-72% of international founders. This is only matched by Zurich (76%), which is a very international city but also benefits from the proximity to Germany and the low language barrier that favors immigration.
City | Country | % Foreign-Born Founders |
Zurich | Switzerland | 76 |
London | United Kingdom | 72 |
Berlin | Germany | 67 |
Barcelona | Spain | 65 |
Amsterdam | Netherlands | 53 |
Stockholm | Sweden | 50 |
Helsinki | Finland | 47 |
Tallinn | Estonia | 45 |
Copenhagen | Denmark | 41 |
Riga | Latvia | 40 |
Vienna | Austria | 40 |
Table 30: Largest share of foreign-born founders by city
Source: Aggregated data of Startup Heatmap Surveys 2016-2020
C) Transnational Connections
Why is it important to map the transnational connections of an ecosystem? Mobility and international connectivity describe the effectiveness of internal infrastructures in the creation of a visible and valuable ecosystem, forming the external players perception regarding the actual and potential value of the entrepreneurial ecosystem.
Since 2016, we run an annual survey among startup founders focused on the brand recognition of startup places and the actual mobility and transnational connectivity of startup founders in Europe. The exploitation of our results allow to understand implicit and explicit connectivity among startup hubs as well as the mapping of founder movements across European ecosystems.
a. Internationalization
The number of startups indicating that they have a transnational company setup with either employees, branches or investors abroad has declined from 57% in 2019 to 48% in 2020. This matches with the picture that 50% of startups usually expand already in their first year of operation and this was more difficult during the pandemic than before.
UK startups are the most international with 70% transnational footprint
When looking at the regional breakdown, we see that founders in the UK and Western Europe remain most international exploiting international relations at a rate of 70% and 68% respectively.
Region | % Transnational Setup |
UK & Ireland | 70% |
Western Europe | 68% |
Nordics & Baltics | 52% |
CEE | 46% |
Mediterranean | 32% |
Benelux | 25% |
Table 32: Percentage of startups with international branches, investors or employees per region
Source: Startup Heatmap Europe Survey 2020
When looking at where startups have these international relations, we can see how global European startups are, with the US and Asia leading the ranking with 27% and 23% of startups having employees, investors or legal branches there. This is a drastic increase in comparison to 2019, where the US and Asia had 13% and 10% shares. Such a large scale difference cannot be explained only by statistical margins of error, especially as the results for other destinations is stable (UK 14% vs 15% and Germany 14% vs 13%). It can therefore also be seen as an increase of attention of European founders towards the US and Asia or an effect of the increased international participation in founding rounds of international VCs in Europe. In both ways, this is a positive development that underscores European founders ambitions to play on the world stage. However, the fact that startups from Europe increasingly look for larger markets outside Europe, might also be seen as a shortcoming of the European Digital Single Market, that still makes it hard to scale a company in Europe, forcing growth companies to quickly move to the US or China, where expansion is easier, even despite the geographic distance.
Where | % |
In the US | 27.27% |
In Asia | 23.38% |
Germany | 14.29% |
Switzerland | 14.29% |
United Kingdom | 14.29% |
Netherlands | 12.99% |
Spain | 7.79% |
Denmark | 6.49% |
Estonia | 6.49% |
In South America | 6.49% |
Table 33: Locations and regions where European startups have the most relations
Source: Startup Heatmap Europe Survey 2020
b. Target markets
31% of European founders see the US as their most important target market
This observation matches with the importance founders give to the target market in the US and increasingly also Asia. To assess the founders’ perception of geographical market trends, we asked them about their take on the most important target market in their industry. Interestingly, only a fraction of the founders chose to name a target market identical to their current location. Only in the UK & Ireland region and the North & Baltic region, about half of the founders stated their respective home market as the most important target market.
Most important target market | % |
USA | 31.15% |
UK | 14.75% |
Germany | 13.11% |
Asia | 9.84% |
Nordics | 9.02% |
CEE | 6.56% |
Southern Europe | 6.56% |
Middle East | 4.10% |
Africa | 2.46% |
France | 1.64% |
South America / LATAM | 0.82% |
Table 31: Most important target market for European startups based on founder opinions
Source: Startup Heatmap Europe Survey 2020
While the regions named most often were the United States, Germany, and the United Kingdom, many founders have a particular global take on target markets, with almost half (47%) choosing a market outside of Europe. Curiously, there are some regional differences in perceived target markets. While some founders from all regions named the US as the target market, founders currently located in the CEE region were significantly more focused on the US. On the other hand, only founders from the West and Benelux regions mentioned Asia as the target market at all.
Graph 12: Business relations of startups between regions
Source: Startup Heatmap Europe Survey 2020
c. Founder Mobility
The most drastic form of internationalization is a change of location of the founders themselves. The results of the survey imply immense importance of personal mobility for the startup scene. About 54% of the respondents stated that their startup is not located in the city they grew up in and more than 27% moved between countries.
27% of European founders are foreign-born
This number has been increasing over the years reaching a maximum in 2019 with 29% of foreign-born founders. This year there was only a slight decrease and likely there was no effect of Brexit or Covid-19 to be observed yet.
The patterns of personal mobility clearly show the attractiveness of the leading ecosystems. Indeed, about 38% of all respondents moved into one of the founder’s top 20 ecosystems in Europe from a place not in the list, while only 8% moved out of one of the top 20 ecosystems.
About a third of foreign-born respondents immigrated from outside of Europe. While the United States, India, and Russia are the most important countries of origin in this sense, the list includes 35 countries on all continents. These numbers illustrate the immense importance of external immigration for the European startup scene. However, there is also much mobility of founders within Europe and the flows of respondents between European regions reveal some interesting patterns:
Graph 11: Movements of founders between regions
Source: Aggregated data of Startup Heatmap Surveys 2016-2020
The UK & Ireland (still) benefit the most from founder migration
Almost 80% of the movements in the dataset are between regions, but there are huge regional differences in mobility gains and losses. The following numbers are the net gains and losses related to all respondents based in the respective region or country: While especially the UK & Ireland (+16%) and Benelux (+12%) regions benefit from founder migration, the CEE (-6%) and Southern Europe (-5%) regions lose founders. On the country level, the differences are even more striking. In Central Eastern Europe, Poland and Czechia have moderate gains of +5% each, while Hungary (-15%), Serbia (-30%), and Ukraine (-63%) have significant losses. A similar diverging pattern can be found in Southern Europe, where Spain (+11%) and Portugal (+4%) gain founders, while Italy (-28%) and Greece (-37%) lose founders. France also has a negative balance with -22%. On the other side, some countries benefit disproportionally. This applies especially to Switzerland (+34%), Luxembourg (+14%), the UK (+13%), and the Netherlands (+13%). The underlying reasons for these patterns are complex and as well related to the personal biographies of the founders as to the characteristics of the respective ecosystems. There does not seem to be a noteworthy correlation with the country size or the macro-economic performance. Last year’s survey collected data on the mobility backgrounds of founders. Interestingly, a third of founders living abroad (33%) stated that they relocated to their current location specifically to start a company there. However, job prospects or previous jobs (32%), personal reasons (22%), and university studies (9%) were also important reasons to relocate.D) Startup Support System (Accelerators)
Accelerators have become a staple in ecosystems, after the concept has seen a rapid proliferation in the past five to ten years. However, some of the new accelerators have yet to make an impact, as there is sometimes little tangible impact of individual programs.
For startups, helpful accelerators select promising startups to establish ties with investors or offer helpful knowledge gains for founders, for example. From an ecosystem perspective, accelerators can offer important support, especially if they operate in a meaningful niche. For example, accelerators can act as rule or agenda setters by creating well-known rules of engagement for cooperation or mentoring. Therefore, established accelerators are often important central reference points within ecosystems. However, poorly run accelerators can also be a liability for an ecosystem, for example by setting bad examples and draining the resources of mentors or volunteers without real returns for the ecosystem.
Further, accelerators can benefit the local ecosystem by stimulating ties and new connections among startups and, for example, corporates. These connections can even reach far beyond the local community, since many startups participate in accelerators in other regions, but keep the ties formed during participating in the accelerator program after returning home.
Top Accelerators in Europe
To understand which accelerators are contributing in a meaningful way to the development of ecosystems, we have gathered a large set of indicators ranging from the popularity to their success in raising follow-up funding. Our team has assessed in detail the companies who participated in 114 accelerators tracking not only where the founders come from to understand how international a program is or whether the CEO is a women, but also what happened after the acceleration. Here we analyzed the job growth and the investment raised. Another important aspect for us was the number of impact and sustainability related startups, which we measure under the metric “Purpose Orientation”. The scoring for each category is explained in the annex of the downloadable version of this report. Generally speaking the highest score of 100 represents the median value of the leadership group per category. Thus if the top 5 accelerators have raised a median of 1,000,000 € an accelerator whose startups raised 500,000 € would reach a score of 50.
Looking at the top 10 we see that four out of the 10 best accelerators are located in London. Seedcamp and Entrepreneur First are tied with 63 points. On third rank is the Europe wide, virtual program of EIT Digital for scale-ups (62). Surprisingly, none of them is leading in the Follow-on funding category. Seedcamp has the highest total amount of follow-up investments in the sample, but is ranked 9th for the percentage of startups raising capital after acceleration. The leader in the follow-up funding category is Alpine House by Superangel in Tallinn (Overall Rank 15th).
The Top 10 has also a few high-performing accelerators in unexpected locations. Plug and Play Accelerator is present with two programs (Munich and Stuttgart), Merck’s Accelerator for Health and BioTech scores 53 points overall and ranks 5th and ABC Accelerator in Ljubliana lands on 8th rank overall. We can conclude that it is definitely possible to build world-class accelerators outside established tech hubs.
|
Score Total |
Program Name |
City |
Popularity Score |
Follow-on Funding |
Female Participation |
Purpose Orientation |
|
63 |
London |
98 |
88 |
22 |
55 |
|
|
63 |
London |
97 |
41 |
45 |
55 |
|
|
62 |
EIT Digital |
Europe Wide |
100 |
55 |
15 |
100 |
|
58 |
Munich |
99 |
81 |
20 |
18 |
|
|
53 |
Darmstadt |
73 |
75 |
62 |
0 |
|
|
52 |
Stuttgart |
99 |
89 |
18 |
0 |
|
|
51 |
London |
96 |
100 |
42 |
36 |
|
|
51 |
Ljubljana |
92 |
39 |
22 |
55 |
|
|
51 |
Europe-wide |
95 |
31 |
37 |
100 |
|
|
48 |
London |
99 |
94 |
33 |
36 |
|
|
46 |
Berlin |
100 |
55 |
76 |
36 |
|
|
45 |
Amsterdam |
96 |
27 |
86 |
36 |
|
|
45 |
London |
100 |
56 |
75 |
36 |
|
|
44 |
Berlin |
98 |
37 |
19 |
55 |
|
|
42 |
Tallinn |
78 |
100 |
17 |
18 |
|
|
42 |
Munich |
88 |
34 |
21 |
100 |
|
|
42 |
Lausanne |
94 |
41 |
30 |
100 |
|
|
41 |
London |
93 |
100 |
42 |
36 |
|
|
41 |
Berlin |
96 |
38 |
100 |
0 |
|
|
41 |
Vienna |
69 |
46 |
27 |
0 |
Table 32: Top 20 Ranking of European Accelerators
Source: See Startup Heatmap Methodology 2020